

Exploring Student's Course Selection Process through a Survey
Understanding how DePaul students choose courses, use resources, and navigate confidence, satisfaction, and challenges.
UX Research
Survey Design
Data Analysis
Data Visualization
Duration
January 2025 - March 2025 (3 months)
Project Type
Group project for coursework
Role
UX Researcher - Survey Designer, Interviewer, Data Analyst
Tools
Qualtrics, RStudio, ChatGPT, Zoom, Microsoft Excel, Microsoft Teams
Overview
Overview
Overview
This case study summarizes a student-led UX research project at DePaul University that examined how students decide on their courses – including which resources they rely on, how confident they feel in their choices, how satisfied they are with their selected courses, and what challenges they encounter. It provides a snapshot of the project’s purpose, methods, and key insights.
Survey Goals and Objectives
The research aimed to understand several aspects of the course selection experience from the student perspective. In particular, the survey set out to investigate four key questions:
Resource Effectiveness: What resources do students use when selecting courses, and how helpful are those resources in decision-making?
Decision Confidence: How confident do students feel when making their course selection decisions?
Course Satisfaction: How satisfied are students with the courses they ended up taking?
Selection Challenges: What challenges or pain points do students face during the course selection process?
At a Glance
At a Glance
At a Glance
48
Responses
* 48 responses were analyzed after cleaning the data of 72 respondents
48
Responses
* 48 responses were analyzed after cleaning the data of 72 respondents
48
Responses
* 48 responses were analyzed after cleaning the data of 72 respondents
6 min 7 sec
of average time taken to complete the survey
6 min 7 sec
of average time taken to complete the survey
6 min 7 sec
of average time taken to complete the survey
71%
Average Perceived Effectiveness of all resources
* Based on a 5-point helpfulness scale
71%
Average Perceived Effectiveness of all resources
* Based on a 5-point helpfulness scale
71%
Average Perceived Effectiveness of all resources
* Based on a 5-point helpfulness scale
Course Catalog
was the most used Resource
Click here for full list
Course Catalog
was the most used Resource
Click here for full list
Course Catalog
was the most used Resource
Click here for full list
Degree Progress Report
was rated the most useful resource
Click here for full list
Degree Progress Report
was rated the most useful resource
Click here for full list
Degree Progress Report
was rated the most useful resource
Click here for full list
Students used these resources
5-8 times/year
at an average
Students used these resources
5-8 times/year
at an average
Students used these resources
5-8 times/year
at an average
72%
Average confidence in selecting courses
* Based on a 5-point confidence scale
72%
Average confidence in selecting courses
* Based on a 5-point confidence scale
72%
Average confidence in selecting courses
* Based on a 5-point confidence scale
78%
Average Satisfaction post course completion
* Based on a 5-point satisfaction scale
78%
Average Satisfaction post course completion
* Based on a 5-point satisfaction scale
78%
Average Satisfaction post course completion
* Based on a 5-point satisfaction scale
70%
of the respondents faced challenges selecting their courses
70%
of the respondents faced challenges selecting their courses
70%
of the respondents faced challenges selecting their courses
Understanding the Relationships
Understanding the Relationships
Understanding the Relationships
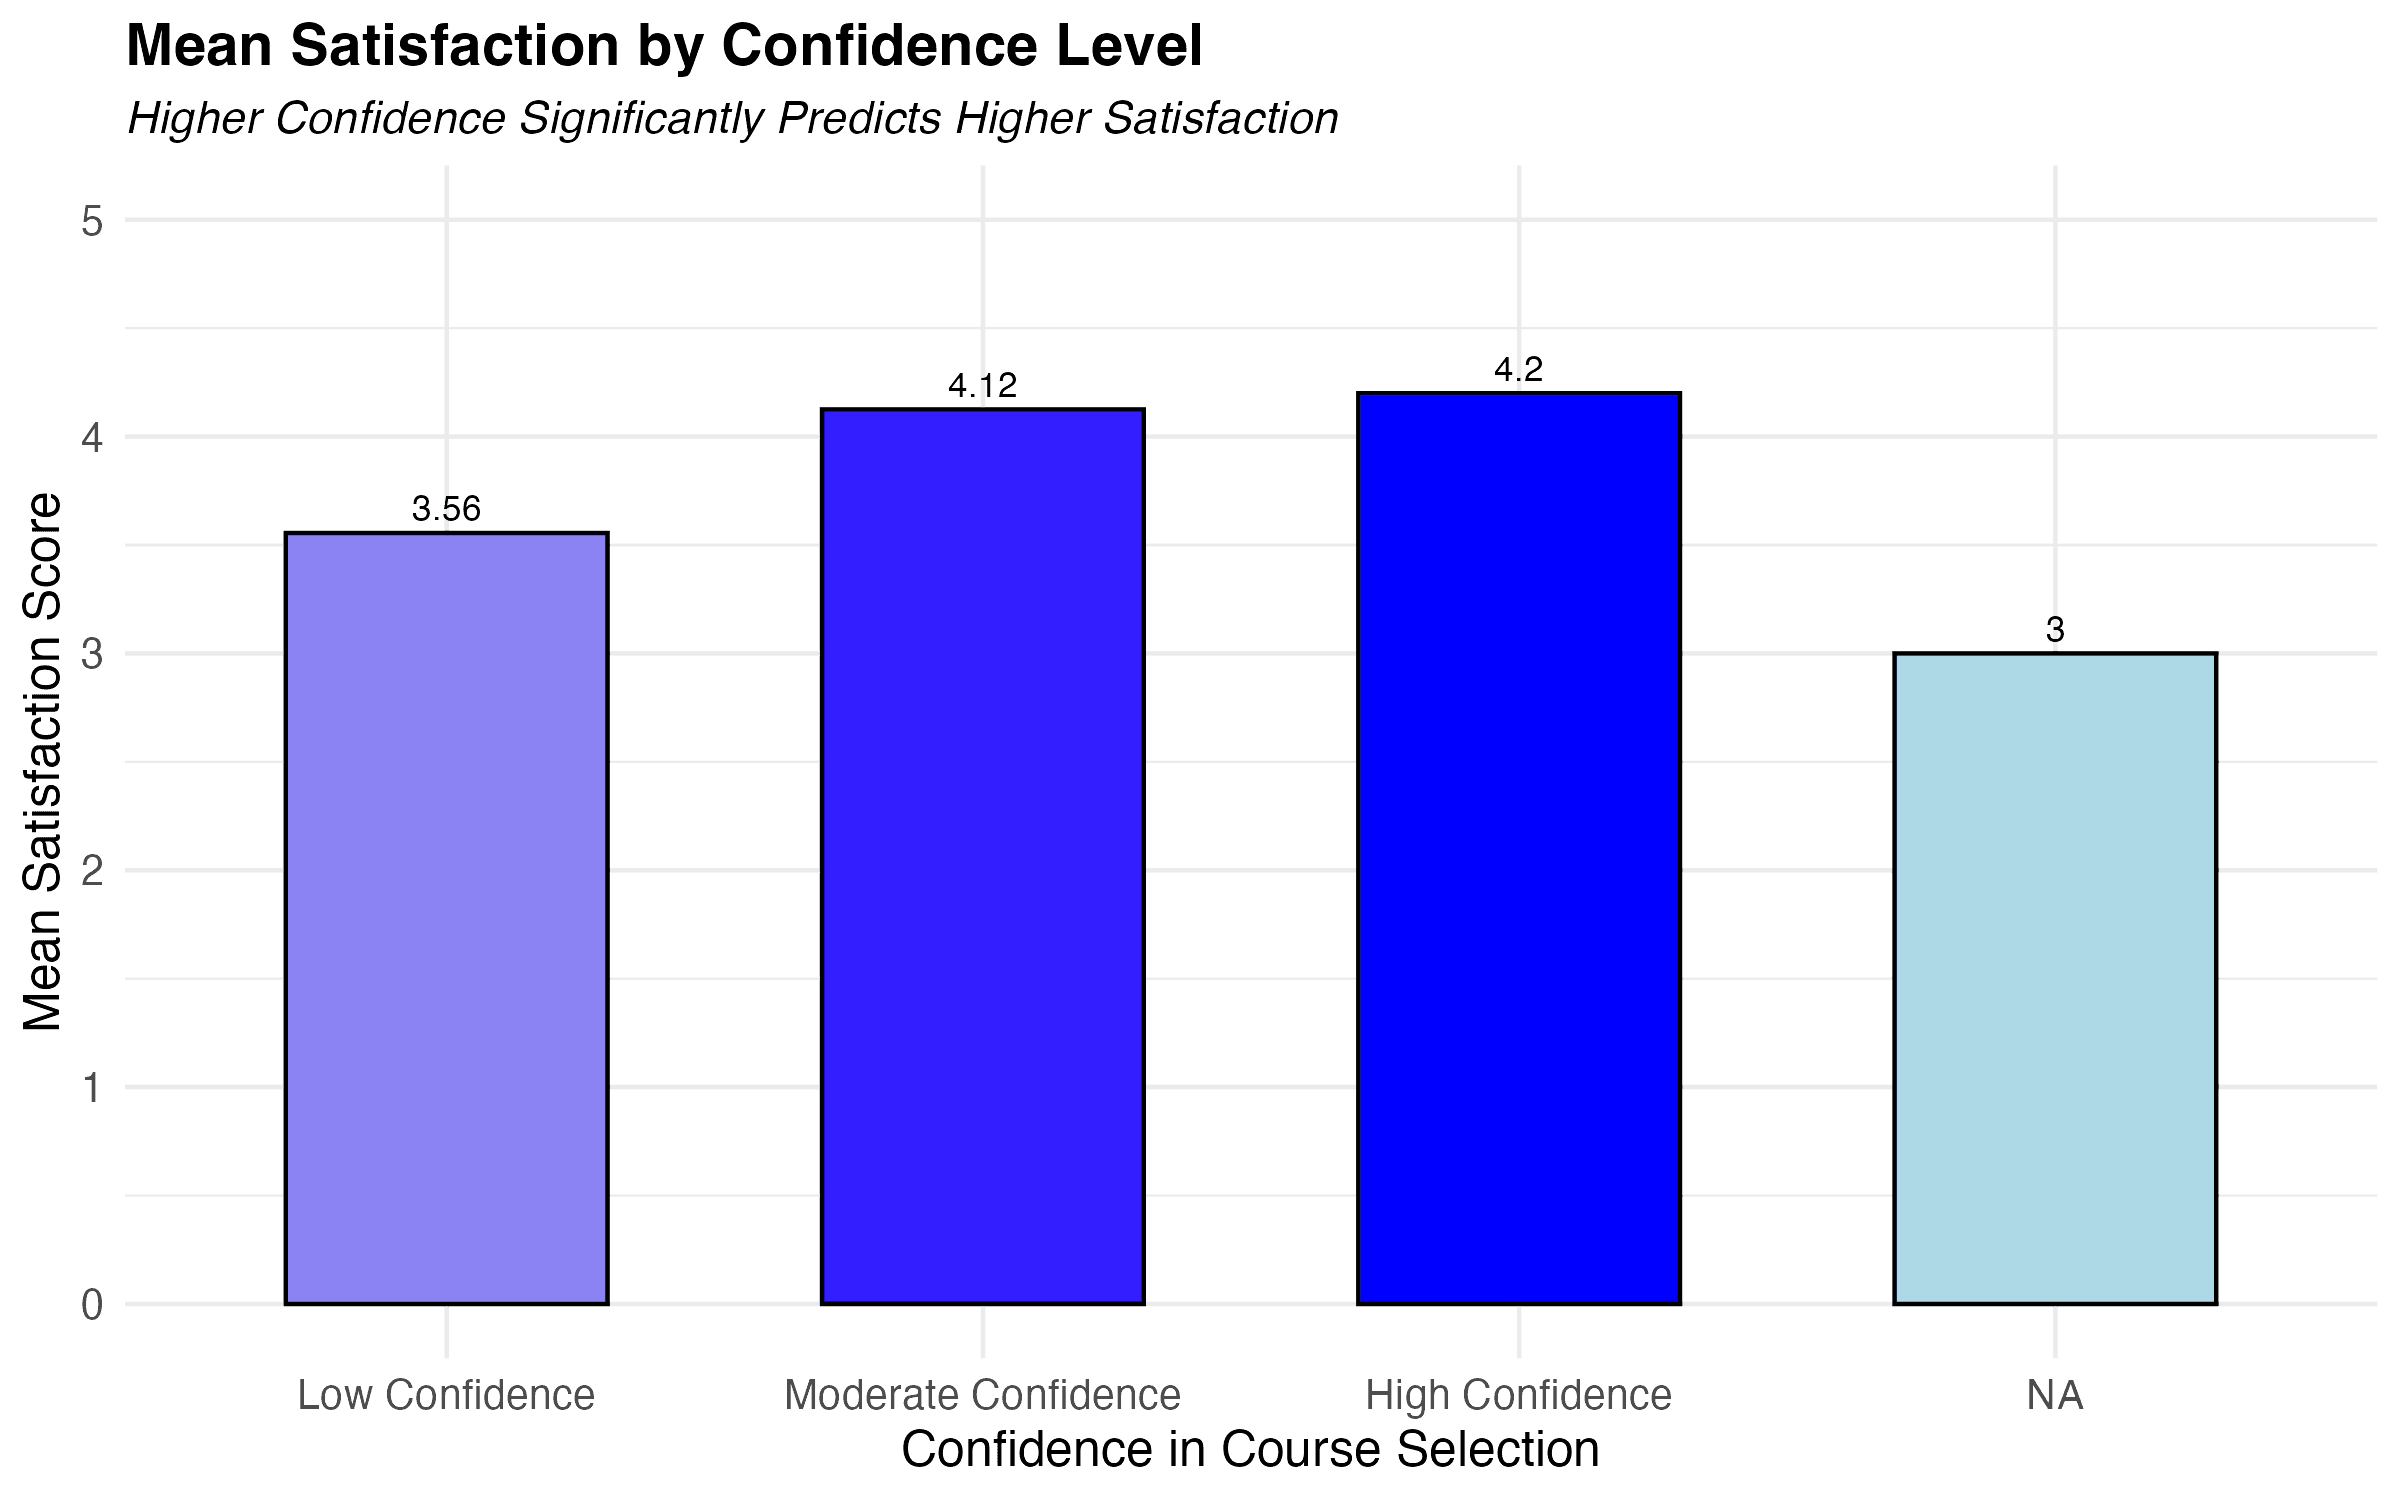
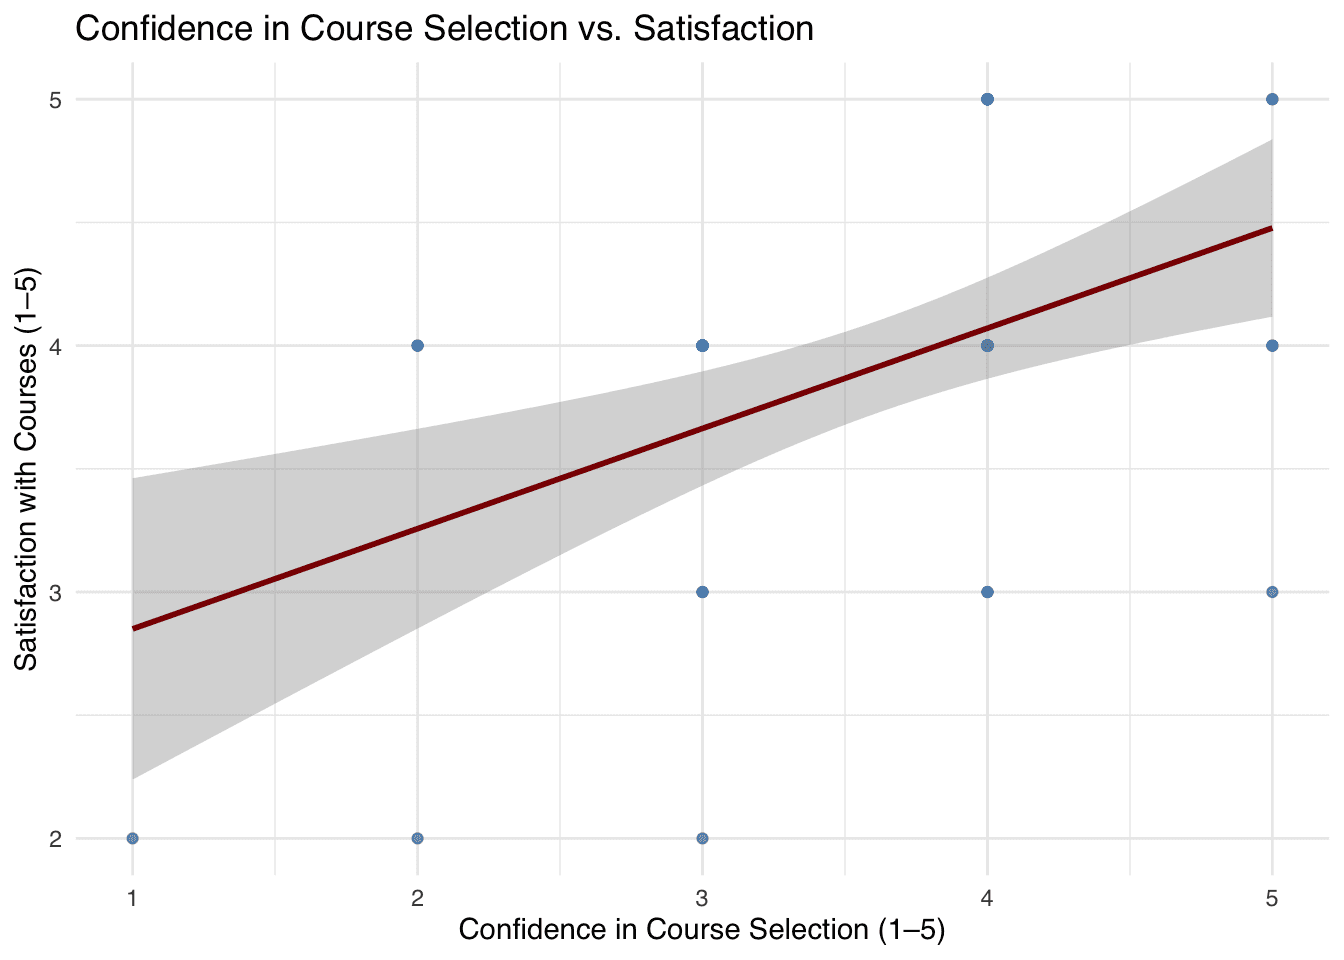
Confidence and Satisfaction Are Linked
Students who felt more confident about their course choices were also more satisfied with the courses they ended up taking.
r = 0.481, p = 0.0006, R² = 0.232
This means confidence explains about 23% of the variation in satisfaction — a moderately strong connection.
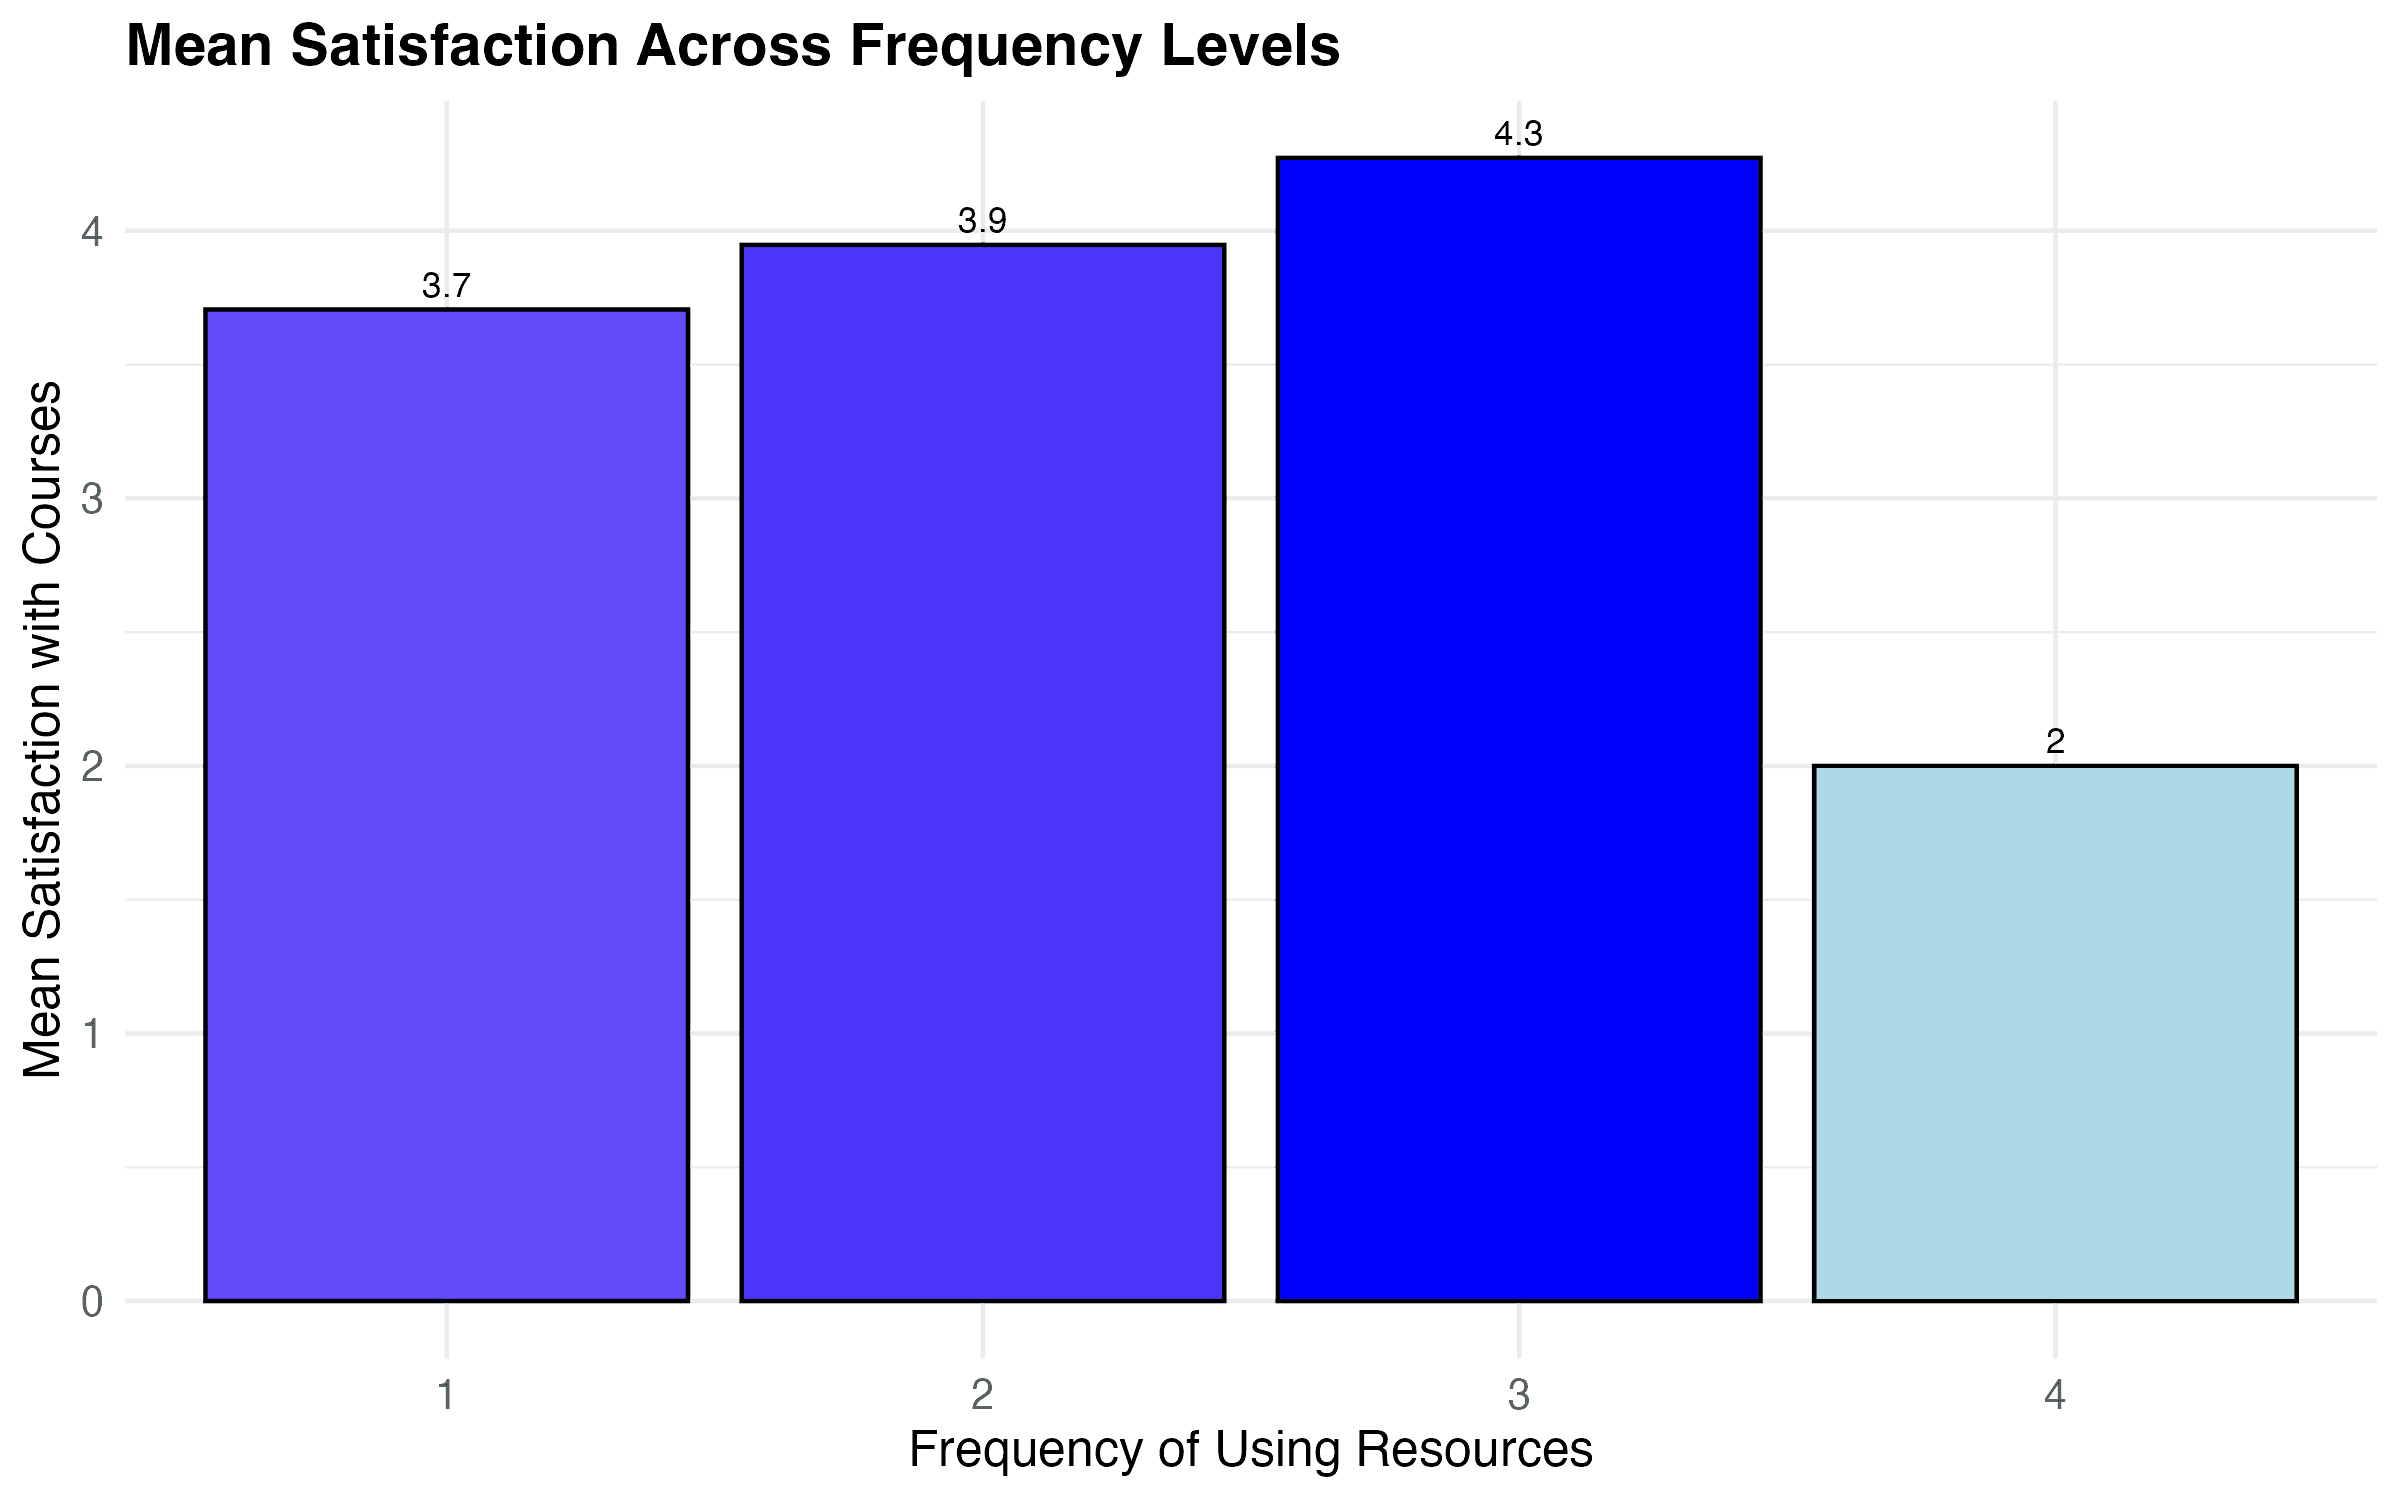
More Isn’t Always Better
Satisfaction increased with moderate resource use but dropped for those who used resources excessively.
ANOVA: F(3,44) = 4.575, p = 0.0071
The highest-use group had significantly lower satisfaction than the moderate-use group (Δ ≈ –1.95, p = 0.028), showing that using more resources doesn’t always lead to better outcomes.
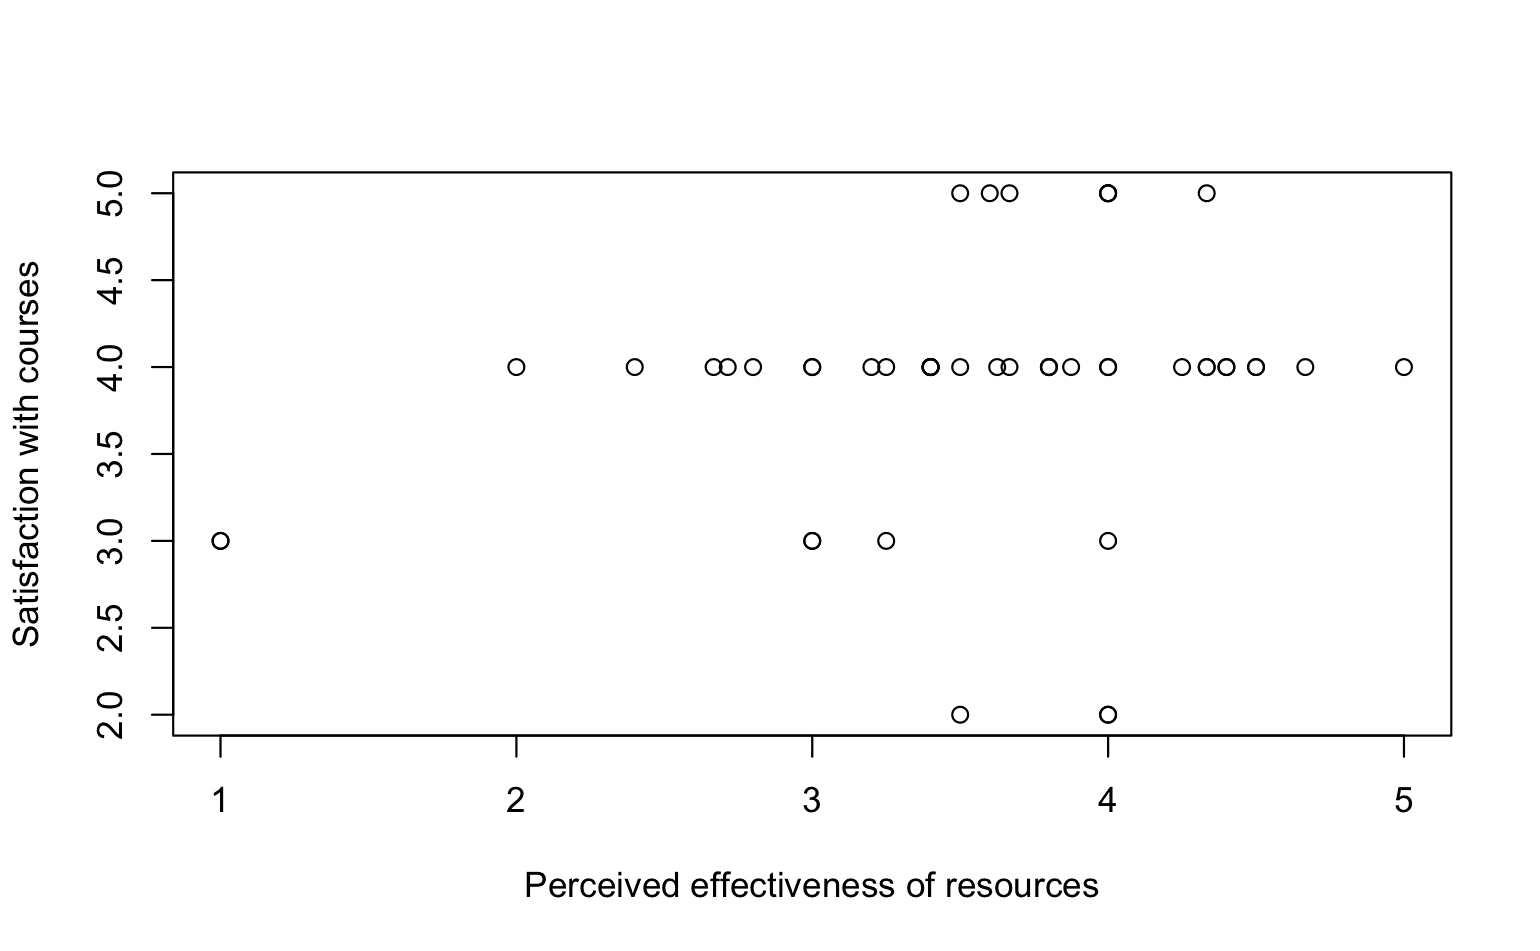
Perceived effectiveness didn’t predict satisfaction
Students who rated their resources as more helpful tended to be slightly more satisfied, but the link wasn’t statistically strong.
r = 0.238, p = 0.103, R² ≈ 0.057
Perceived helpfulness explained just 5.7% of the variation in satisfaction — suggesting that feeling helped doesn’t always translate to better outcomes.
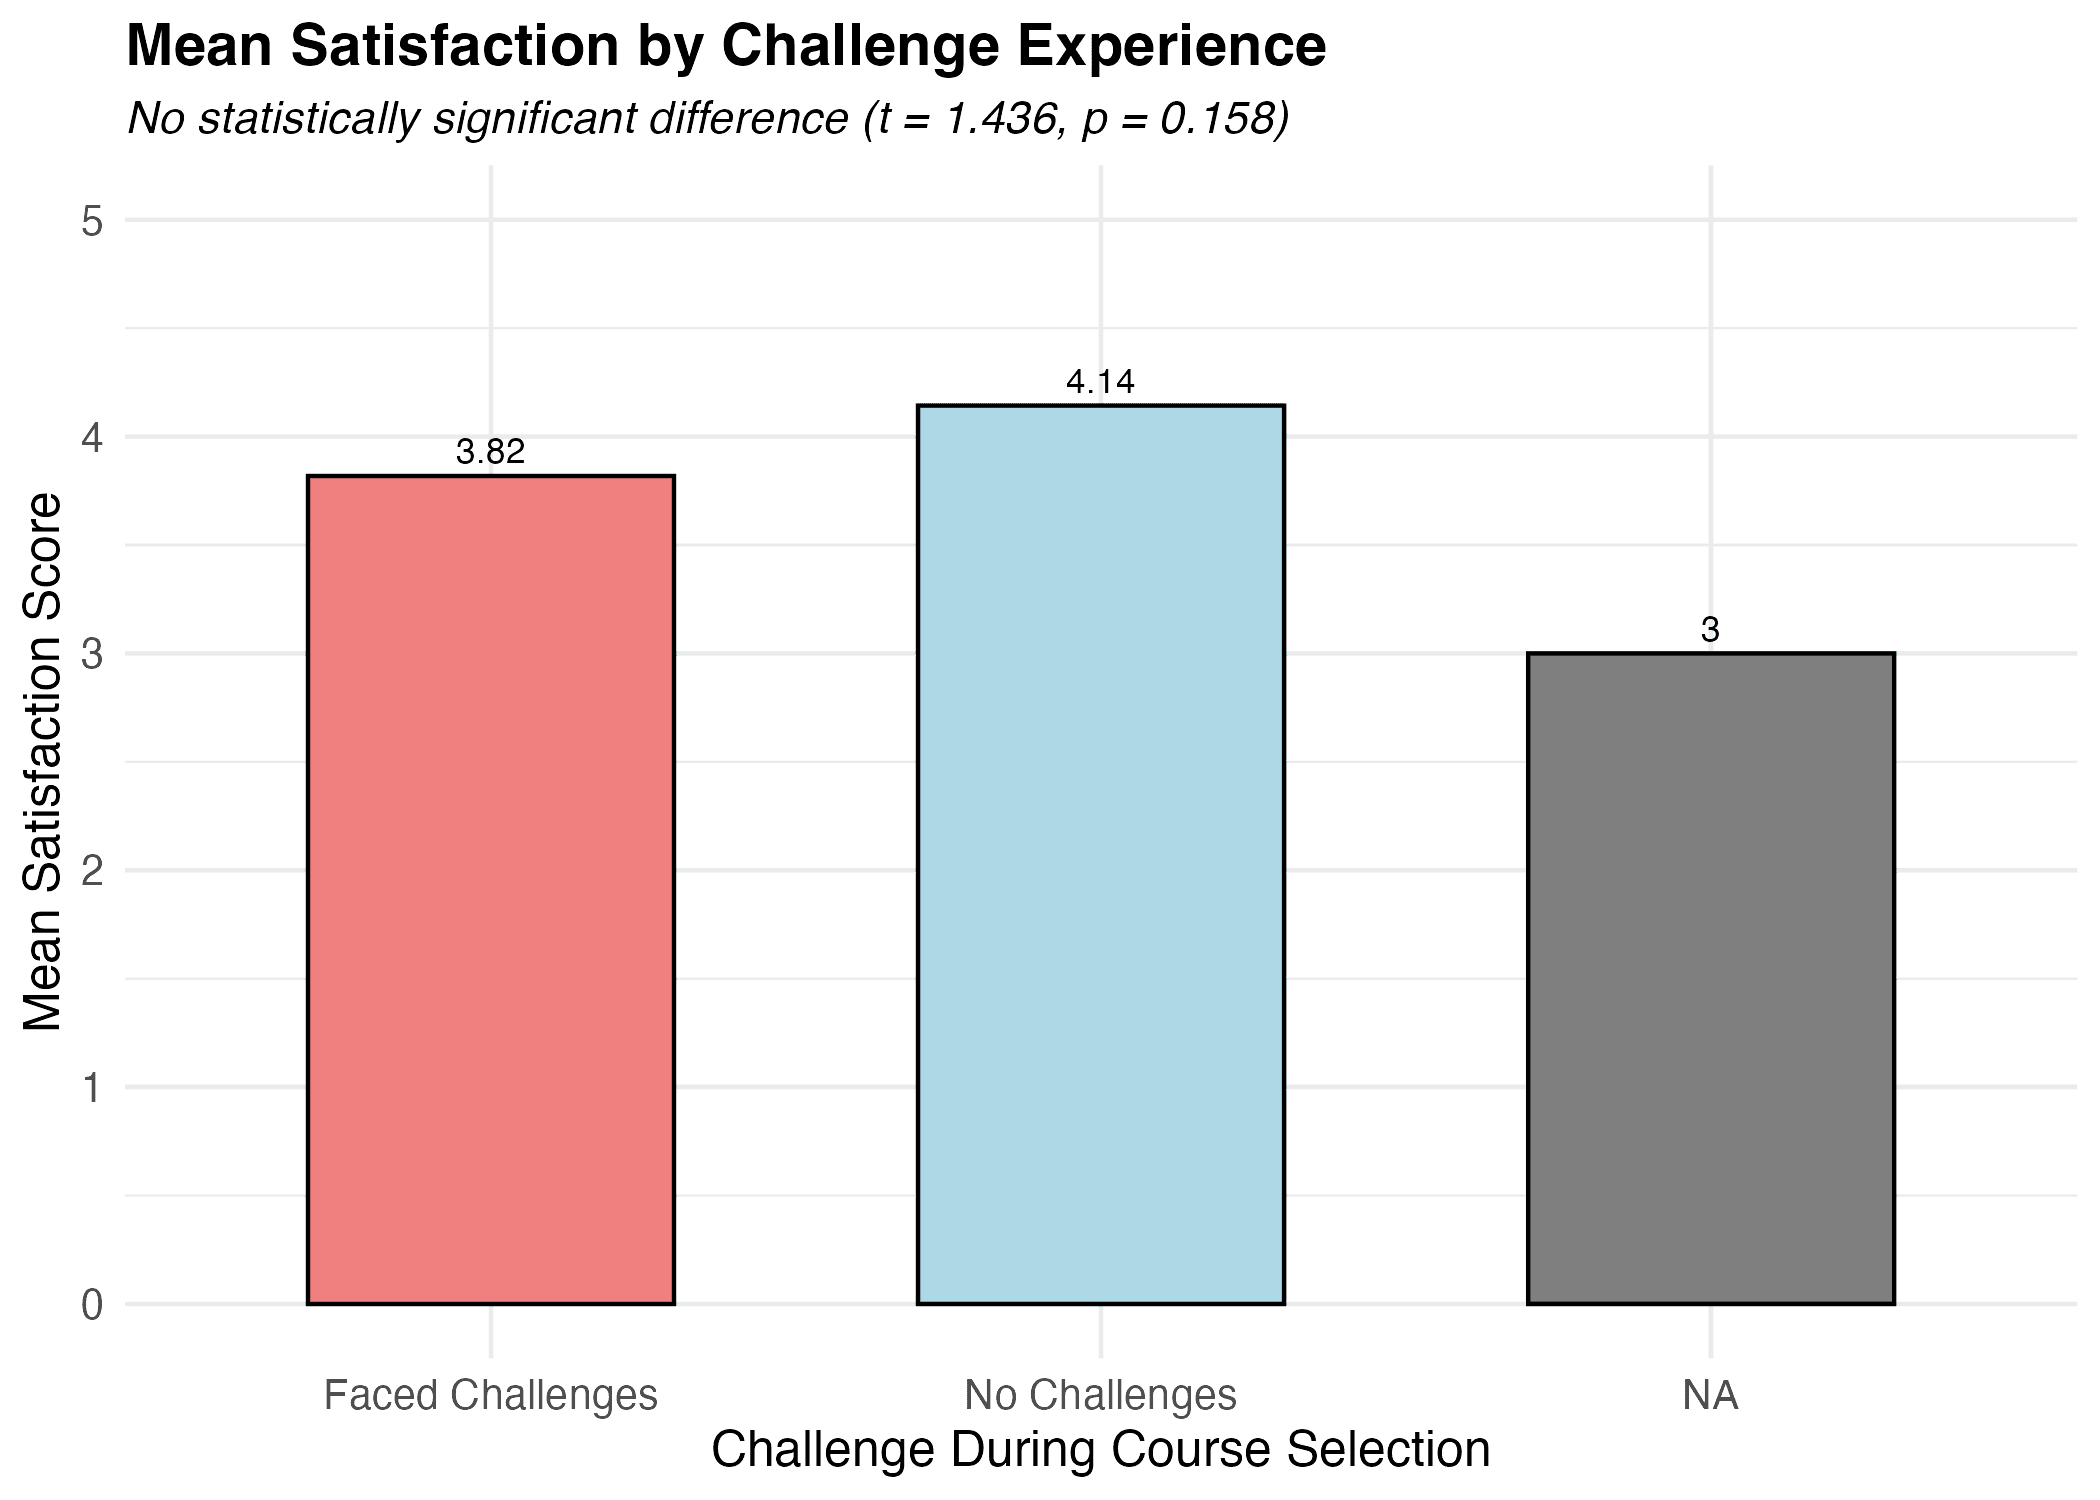
Facing Challenges Didn’t Affect Satisfaction
Students who faced course selection challenges had slightly lower satisfaction (3.82) than those who didn’t (4.14), but the difference wasn’t statistically significant.
t = 1.436, p = 0.158
This suggests that facing difficulties didn’t reliably impact how satisfied students felt with their courses.
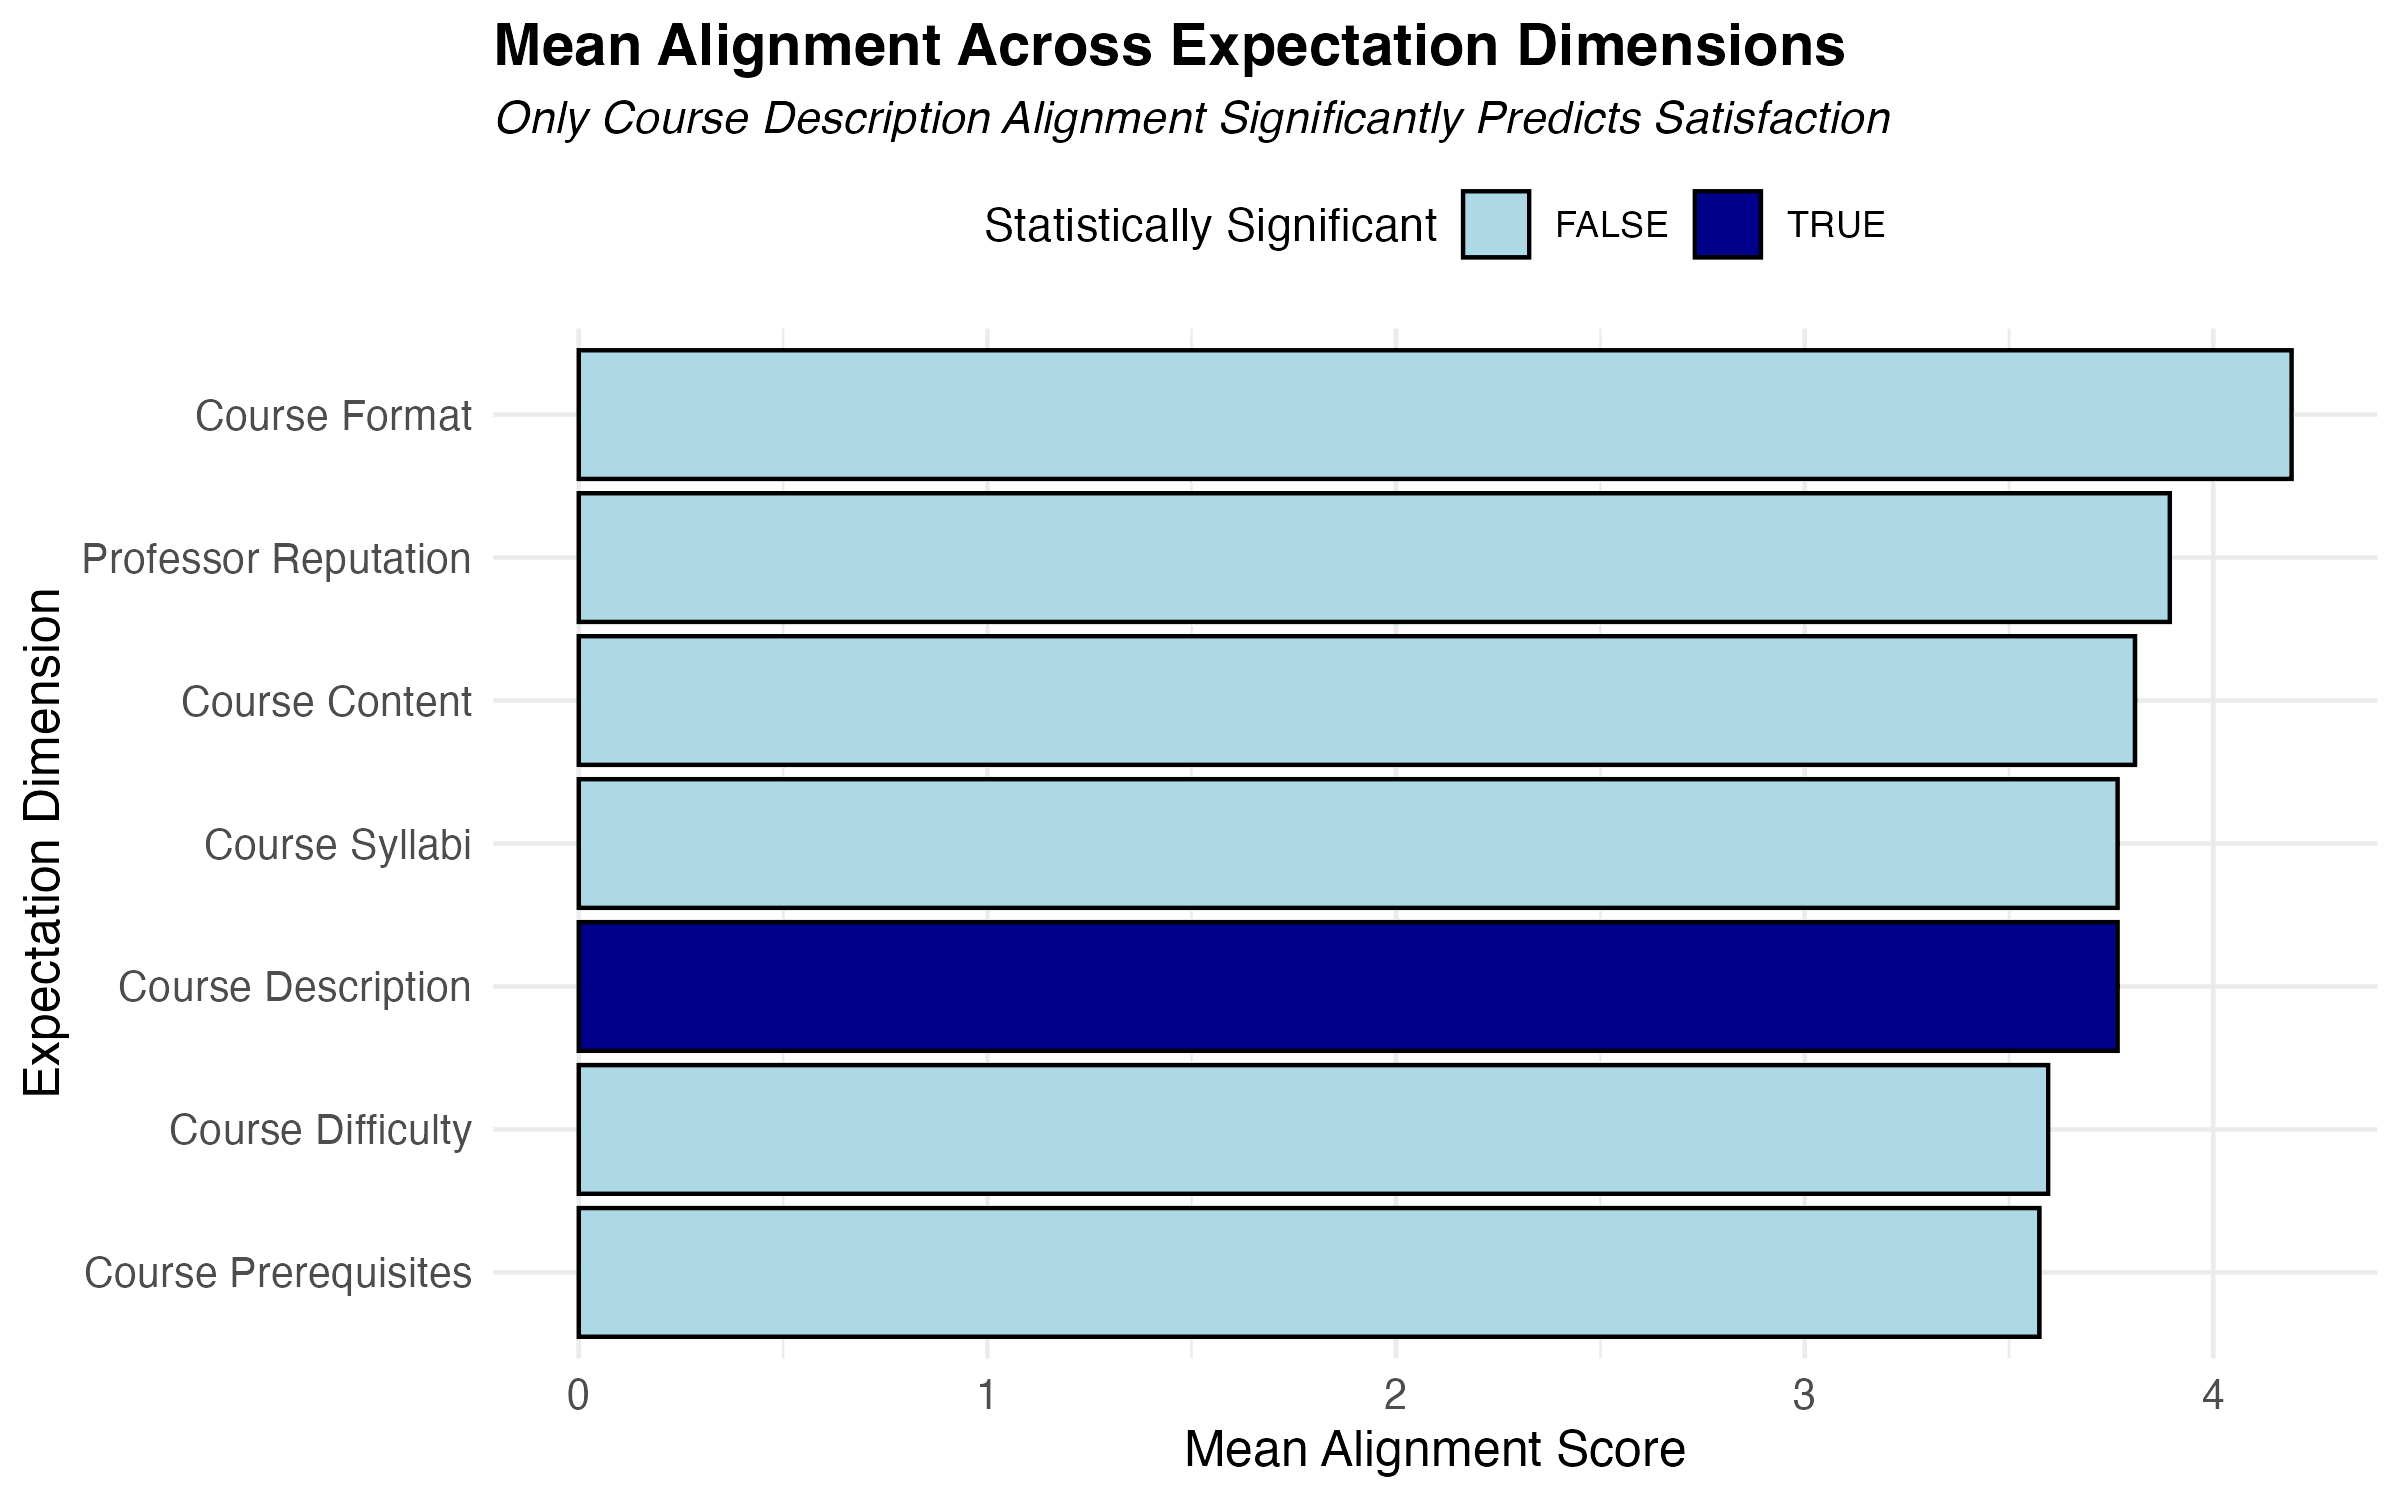
Accurate Course Descriptions Drove Satisfaction
Of all the factors students compared to their expectations, only how well the course matched its description was linked to satisfaction.
β = 0.358, t = 4.116, p = 0.00016, R² = 0.274
This single factor explained 27.4% of the variation in satisfaction — more than any other expectation-related variable.
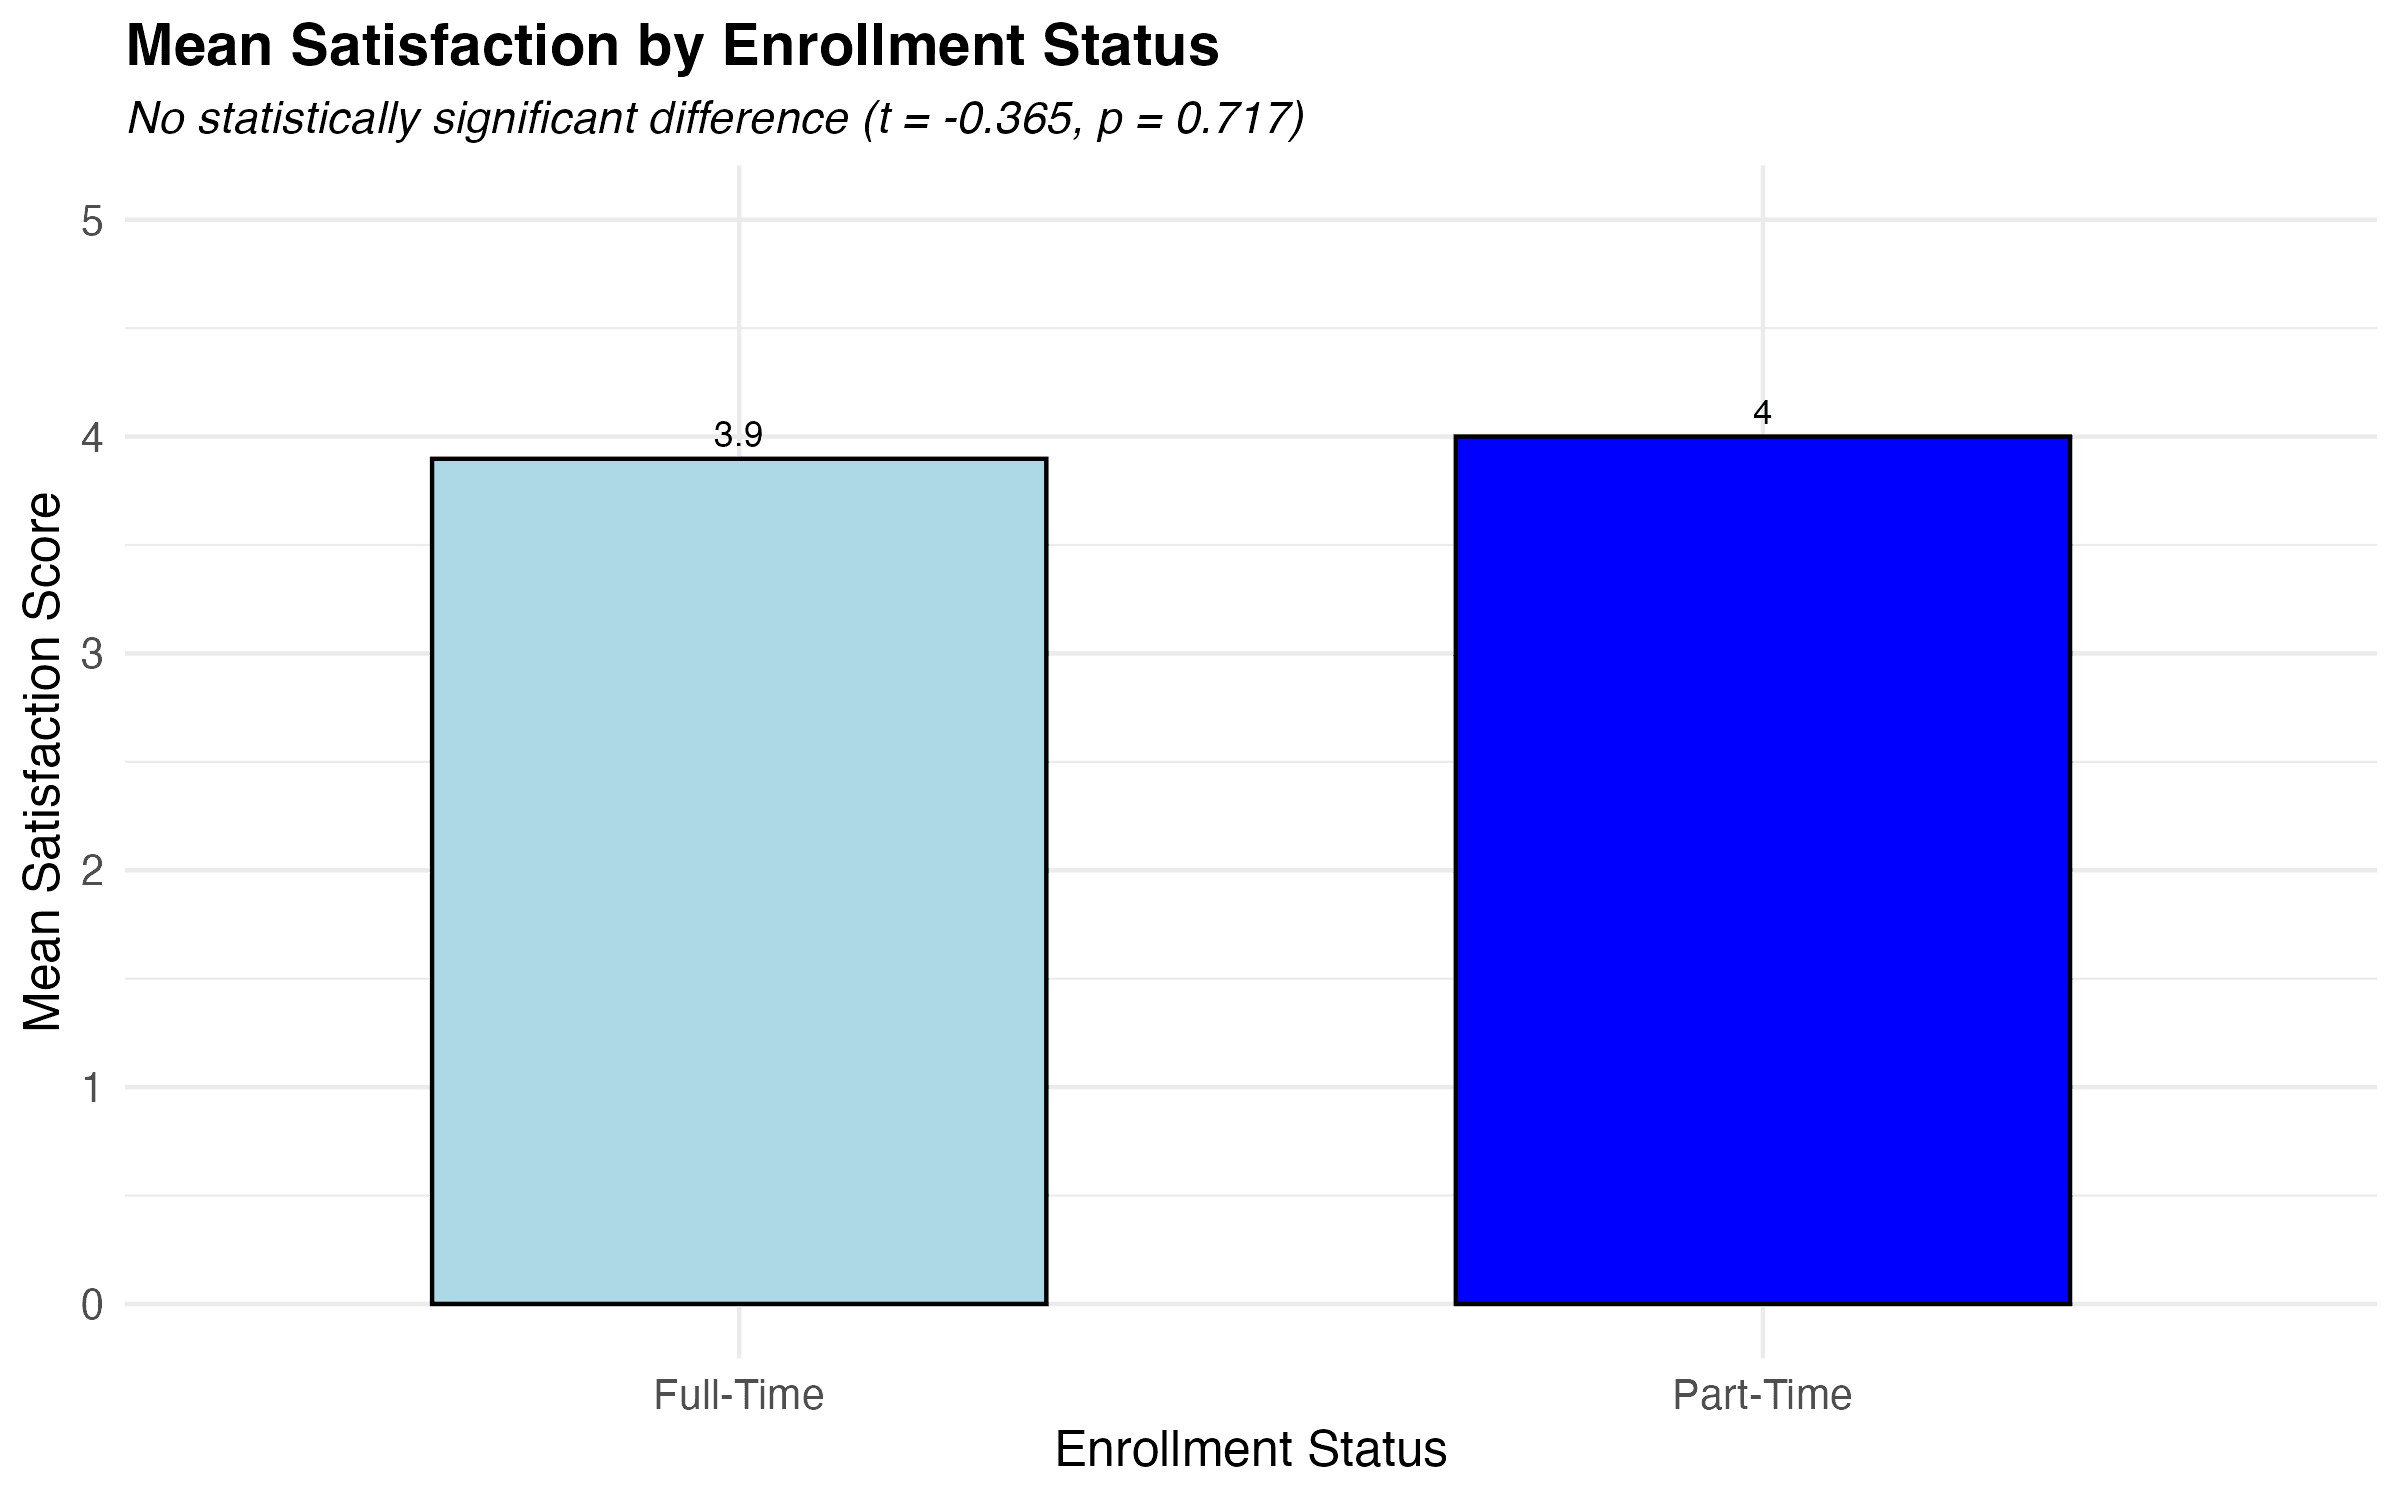
Full-Time vs Part-Time: No Difference in Satisfaction
Both full-time and part-time students reported similar satisfaction levels.
t(45) = –0.365, p = 0.717
Average satisfaction was 3.90 for full-time and 4.00 for part-time students — not a statistically significant difference.
Full-Time vs Part-Time: No Difference in Satisfaction
Both full-time and part-time students reported similar satisfaction levels.
t(45) = –0.365, p = 0.717
Average satisfaction was 3.90 for full-time and 4.00 for part-time students — not a statistically significant difference.
Full-Time vs Part-Time: No Difference in Satisfaction
Both full-time and part-time students reported similar satisfaction levels.
t(45) = –0.365, p = 0.717
Average satisfaction was 3.90 for full-time and 4.00 for part-time students — not a statistically significant difference.
Where This Research Can Lead Next
Where This Research Can Lead Next
Where This Research Can Lead Next
While most relationships we uncovered were not strongly predictive on their own, the analysis still offers a valuable starting point. It highlights patterns, surface-level trends, and gaps that can guide future studies. Before refining or expanding this survey, the next step would benefit from qualitative research to uncover additional factors that influence satisfaction — the kinds of experiences, expectations, or decision-making moments that a fixed-choice survey may have missed.
Based on this study, here are a few directions to consider:
Explore open-ended feedback: Interviews or diary studies could help uncover why students feel satisfied or overwhelmed — especially in cases where confidence, helpful resources, or challenge levels didn’t directly predict satisfaction.
Identify missing variables: The survey didn’t account for personal motivation, academic outcomes, or emotional context — factors that likely influence satisfaction but were not included. Future surveys could evolve by integrating such overlooked variables.
Rethink information delivery: Since course description alignment was the clearest predictor of satisfaction, future designs could experiment with richer course previews — sample syllabi, video overviews, or tagged course outcomes tied to student goals.
Balance guidance and overload: The inverted-U pattern around resource usage suggests that more support isn’t always better. Future systems might include light-touch nudges, confidence check-ins, or curated resource summaries to help students stay informed without feeling overwhelmed.
How We Designed the Survey
How We Designed the Survey
How We Designed the Survey
To ensure our questions were clear, relevant, and interpreted as intended, we conducted nine cognitive interviews using a think-aloud protocol. We applied the CASM framework — assessing Comprehension, Retrieval, Judgment, and Response — to understand how participants mentally processed each question. This structured probing helped us catch subtle yet critical issues: ambiguous language, overly complex matrix questions, and inconsistent interpretations of terms like “advisor” or “course catalog.” For more information, you can find the full report here.
We Iterated Before Launch
Based on the interviews, we revised nearly every section:
Clarified ambiguous terms with examples.
Adjusted confusing frequency and expectation-based scales.
Restructured matrix-style questions to reduce cognitive overload.
Added logic branching to ensure cleaner paths through the survey.
Our design followed a deliberate “easy–difficult–easy” pattern to minimize drop-off: starting with resource questions, transitioning into reflection-based items (satisfaction and expectations), and ending with simple demographic queries.